A panel that shows the money, not just the records
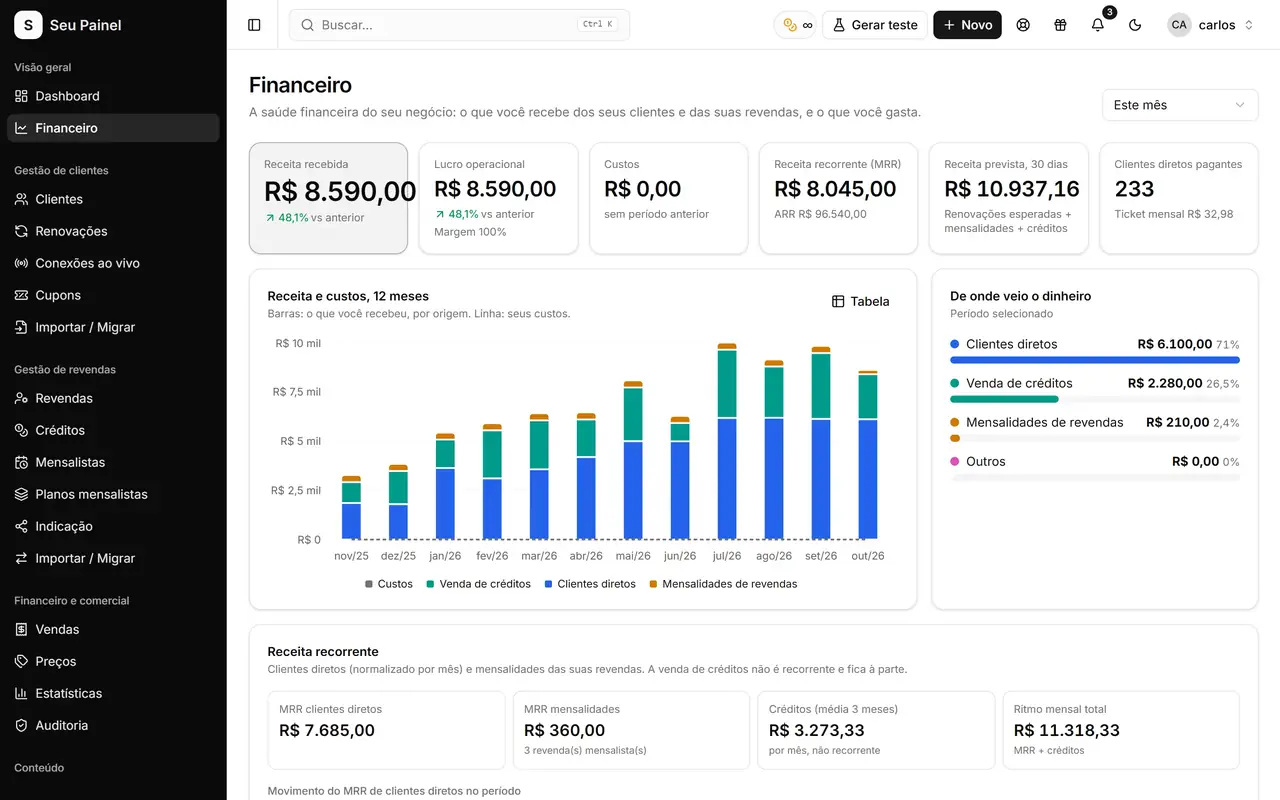
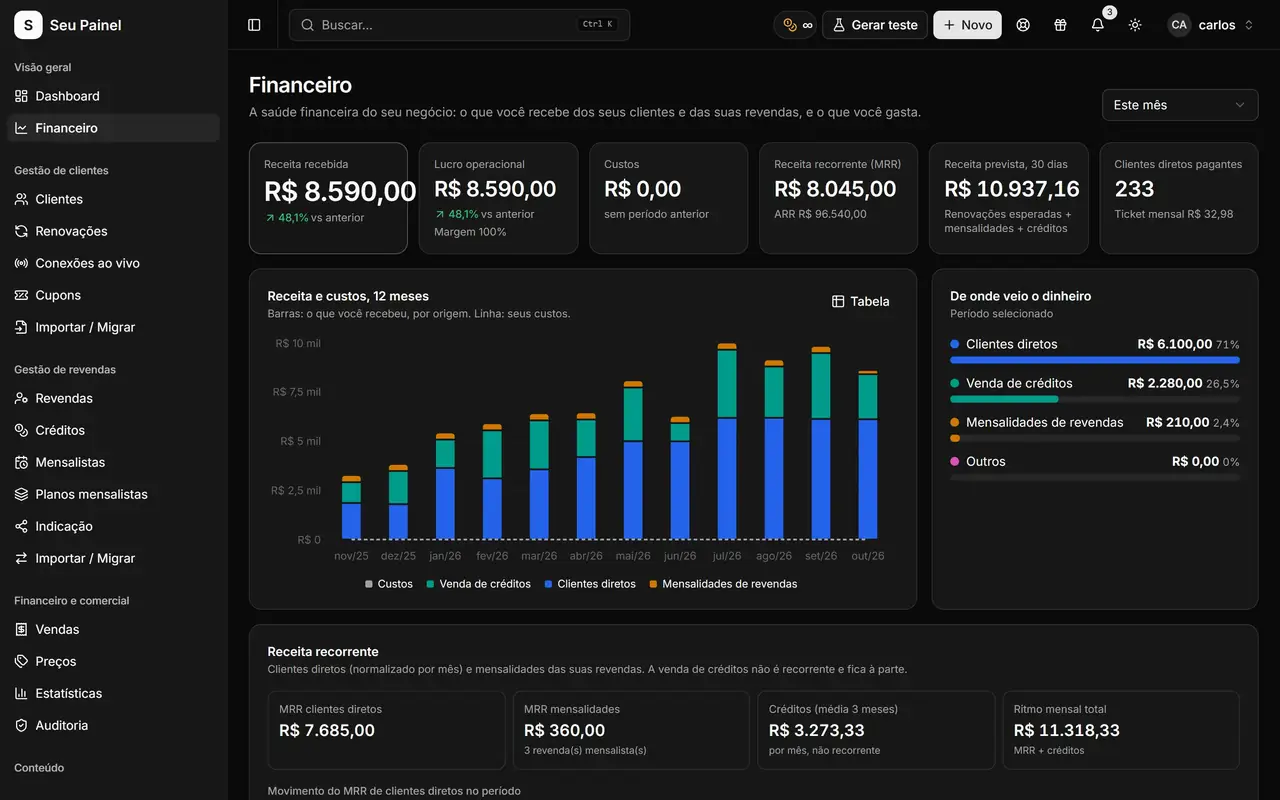
Managing subscriptions without seeing the numbers is driving in the dark. In Painel Blend, everything that happens in your operation becomes financial information: each renewal, each credit sale, each customer who starts with a trial and becomes a subscriber. No exporting spreadsheets, no stitching data together from different places.
The Finance screen brings together MRR (monthly recurring revenue), revenue split by source and a chart of the last 12 months. That makes it easy to answer the questions that matter: is revenue really growing? How much comes from renewals and how much from selling credits to your network? Which month dipped, and why?
A Dashboard that shows portfolio health
The Dashboard is the first screen of the day. It shows portfolio health, upcoming expirations, revenue for the month, the trial funnel (how many trials were generated and how many converted) and retention. When expirations show up there, you act before losing the customer, with automatic reminders and Pix renewals.
Statistics helps you analyze longer periods, and the Sales screen lists what was sold, by whom and when.
Prices, bundles and bonuses in one place
On the Prices screen you set your own values, plan bundles, credit packages and bonuses. This is where you shape the commercial policy of your credit-based reseller network: what each credit costs, which package carries a bonus and what each level pays. Since Finance uses those same prices, you see the effect of every change on your results.
Audit: who did what
In an operation with several people and several resellers, knowing who performed each action prevents disputes and gives you peace of mind. Audit records panel operations with user and time, and role permissions define who can see financial values. To see how this fits into protecting your account, check security and backups.
If you want to go deeper into metrics like MRR and retention, the article MRR and retention metrics explains how to read and use these numbers day to day.
A practical tip: set aside a few minutes each week to compare this month’s revenue with the same period last month and check your trial conversion rate. If conversion drops, review the trial message and duration; if retention drops, strengthen your expiration reminders. With the numbers in the same panel you operate from, every adjustment becomes a data-driven decision instead of a hunch.